$400 NZD/hour large project
A typical project that would take three to six months.
You will get equivalent of :
- Data Scientiest x2
- Data Analyst
- Business Analyst x2
- Technology and Data Lead
- Engagement and Communication Lead
Large analytical project

Scenario
A retail company is looking to analyze its sales data to gain insights into its customers' buying behavior. The sales data is stored in a legacy monolith database that is on-premise. The company wants to move this data to a new cloud infrastructure in Azure for analysis.
In this scenario, the source of the data is the legacy monolith database that is on-premise. This database holds all the sales transactions that have been made by the customers of the retail company. The data stored in this database includes information such as customer details, product details, and transaction details.
The goal of the source identification step is to determine the specific database and tables within the database that hold the relevant sales data. This could involve working with the database administrator to gain access to the database and querying it to determine the structure and content of the relevant tables.
Once the source of the data has been identified, the next step is to extract the data from this source and prepare it for analysis. The extracted data may need to be transformed and cleaned to make it usable for analysis, and the transformed data will then be loaded into the new cloud infrastructure in Azure for analysis.
Step by step
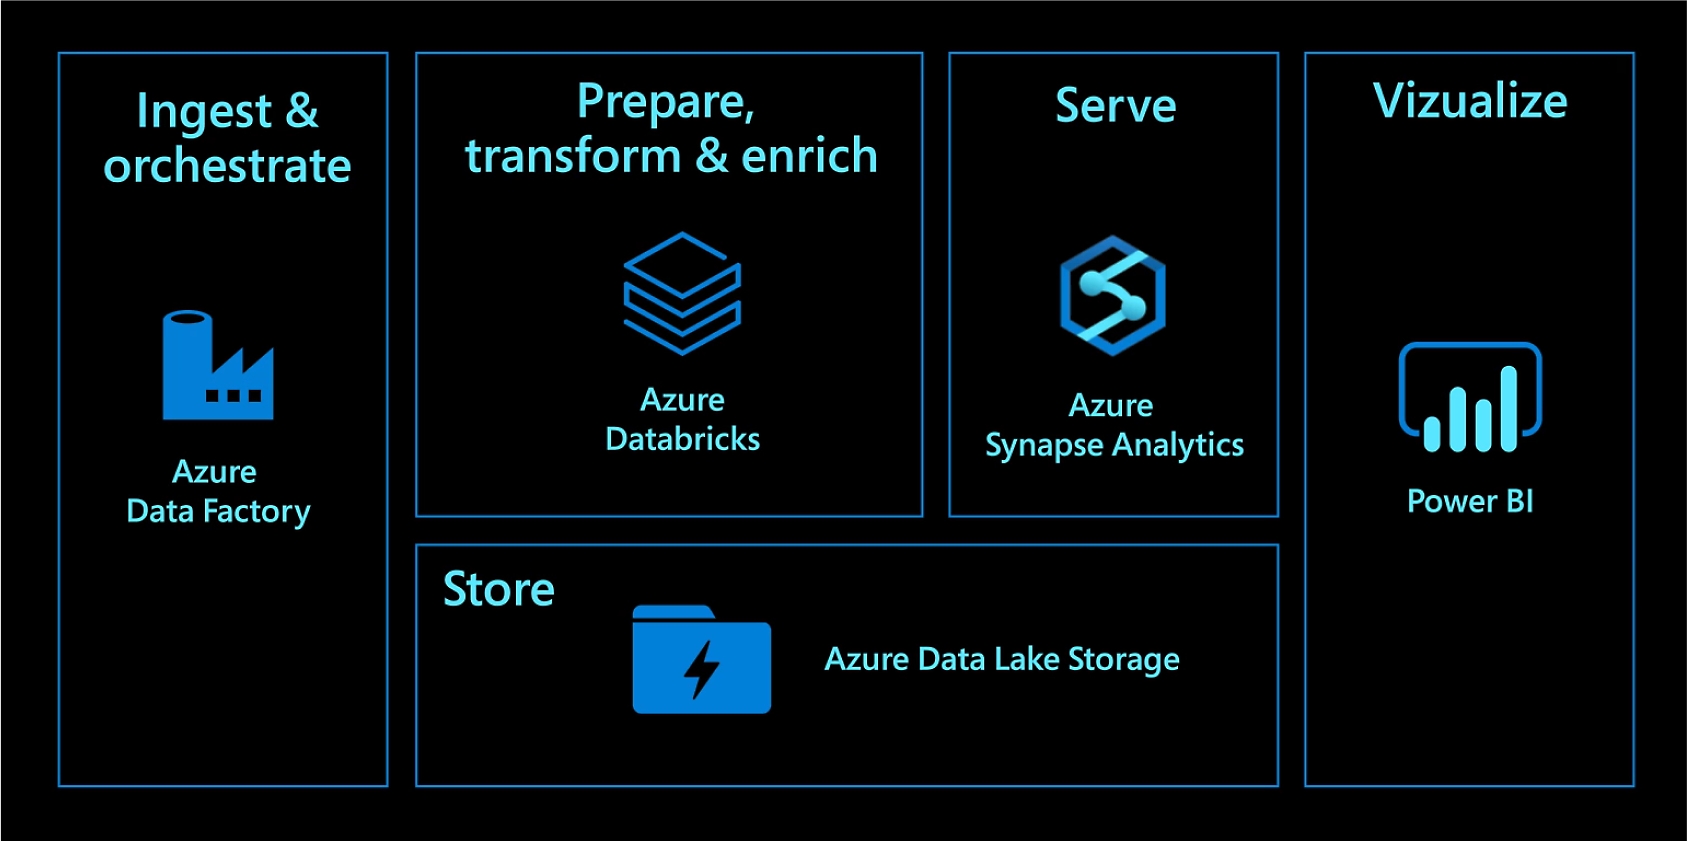
From a technical point of view a large analytical project typically involves the following components:
-
Data Ingestion: This is the process of collecting data from various sources and bringing it into the analytical system. In this project, the data is being ingested from a legacy monolith database that is on-premise. The data needs to be transferred to a new cloud infrastructure in Azure.
-
Data Storage: Once the data has been collected, it needs to be stored in a suitable format. In this project, the data is stored in Azure Blob, which is a scalable and cost-effective object storage solution.
-
Data Preparation: The data collected from the various sources may need to be cleaned, transformed, and aggregated to prepare it for analysis.
-
Data Analytics: The prepared data is then used for various analytical purposes, such as exploratory data analysis, statistical analysis, and machine learning.
-
Automation: To streamline the process, the data ingestion, preparation, and analysis steps are automated using Databricks and Data Factory. Databricks provides an environment for big data processing and machine learning, while Data Factory provides a managed service for orchestrating data movement and transforming data at scale.
-
Data Visualization: The insights gained from the analysis are then visualized using tools such as Power BI, Tableau, or other data visualization tools to make it easier to understand and communicate the results to stakeholders.
These are the main components of a large analytical project. The specific steps and tools used may vary depending on the requirements and complexity of the project.
Data Ingestion
Data ingestion is a crucial step in a large analytical project as it involves the collection of data from various sources and bringing it into the analytical system. The following are the typical steps involved in data ingestion:
Source Identification
The first step is to identify the sources from which the data will be collected. This could be a database, a file system, a web service, or any other data source.
Entity mapping
In the source identification step of data ingestion, entity mapping is the process of identifying and mapping the entities within the source data to their corresponding entities in the target system.
Entity mapping involves identifying the relationships between the data entities in the source system and the target system. For example, in a sales data scenario, the source system may have a "customer" entity, while the target system may have a similar "customer" entity. The goal of entity mapping is to ensure that the relationships between the "customer" entities in the source and target systems are correctly defined and maintained.
This process can involve defining the relationships between the data entities in a mapping document or using mapping software to automate the process. The mapping document or software will specify how each entity in the source system maps to an entity in the target system, including the attributes of each entity and how they are related to one another.
Entity mapping is an important step in the data ingestion process because it helps ensure that the data being ingested into the target system is accurate and consistent. It also helps to eliminate data duplication and ensures that the relationships between the entities are correctly maintained. This, in turn, helps to ensure that the data is ready for analysis and can be used to gain meaningful insights.
Data Extraction
Once the sources have been identified, the next step is to extract the data from these sources. This could involve using SQL queries to extract data from a database, using APIs to extract data from a web service, or copying data from a file system.
Architecture patterns
There are several architecture patterns that can be used when identifying and mapping the data entities in the source system during the data ingestion process. Some of the commonly used patterns are:
-
Extract, Transform, Load (ETL) Pattern: The ETL pattern involves extracting the data from the source system, transforming it to match the structure and format of the target system, and then loading it into the target system. This pattern is commonly used for batch data processing, where large amounts of data are processed in periodic runs.
-
Extract, Load, Transform (ELT) Pattern: The ELT pattern involves extracting the data from the source system, loading it into the target system, and then transforming it to match the structure and format of the target system. This pattern is commonly used for real-time data processing, where data is processed as soon as it is received from the source system.
-
Data Virtualization Pattern: The data virtualization pattern involves creating a virtual view of the data in the target system, without physically moving the data from the source system. This pattern is commonly used when the data sources are large and complex, and it is not feasible to move the data to the target system.
-
Data Replication Pattern: The data replication pattern involves replicating the data from the source system to the target system, either in real-time or in batch mode. This pattern is commonly used when the data sources are critical and need to be available in real-time, or when the data sources are large and complex and need to be processed in batch mode.
Data cloud elements
Once the sources have been identified in the data ingestion process, cloud elements such as Azure Databricks and Azure Data Factory can be used to extract the data from the source system and prepare it for analysis.
Azure Databricks is a fast, easy, and collaborative Apache Spark-based analytics platform that can be used for data processing and analysis. It provides an interactive environment for data exploration, as well as the ability to run complex data processing pipelines. Azure Databricks can be used to extract the data from the source system, clean and transform it, and load it into Azure Blob Storage or another data store for further analysis.
Azure Data Factory is a cloud-based data integration service that can be used to automate the data ingestion process. It provides a visual interface for designing, executing, and monitoring data pipelines, making it easy to extract the data from the source system and load it into the target system. Azure Data Factory supports data sources such as on-premise databases, cloud databases, and file systems, making it a versatile tool for data ingestion.
Both Azure Databricks and Azure Data Factory provide a scalable, flexible, and secure environment for data ingestion, making them ideal for processing large amounts of data. They can be used together or separately, depending on the specific needs and requirements of the project.
These cloud elements provide a powerful and cost-effective solution for data extraction and preparation, making it easy to gain insights from the data and make data-driven decisions.
Extraction type
There are several methods that can be used to extract data from a source system as part of the data ingestion process:
-
Batch Extraction: Batch extraction is a method of extracting data in large, periodic runs. It is commonly used for extracting data from legacy systems, where the data is not updated in real-time. Batch extraction is suitable for extracting large amounts of data, and it can be automated using tools such as Azure Data Factory.
-
Real-time Extraction: Real-time extraction is a method of extracting data as soon as it is updated in the source system. It is commonly used for extracting data from modern systems, where the data is updated in real-time, and it is critical that the data is available for analysis as soon as possible. Real-time extraction can be implemented using tools such as Azure Event Hubs or Apache Kafka.
-
Full Extraction: Full extraction is a method of extracting all of the data from a source system. It is commonly used for initial data ingestion or when the data in the source system has been updated and it is necessary to update the target system with the latest data. Full extraction can be automated using tools such as Azure Data Factory.
-
Incremental Extraction: Incremental extraction is a method of extracting only the data that has been updated since the last extraction. It is commonly used for ongoing data ingestion, where it is necessary to keep the target system up-to-date with the latest data. Incremental extraction can be automated using tools such as Azure Data Factory or Apache Nifi.
Data Storage
After the data has been extracted, it needs to be loaded into the analytical system. This could involve uploading the data to a cloud storage solution like Azure Blob, or loading it directly into a data lake or a data warehouse.
When storing data in the cloud, there are several options available, including Azure Blob Storage, Amazon S3, and Azure SQL Database. Each storage solution has its own strengths and weaknesses, and the best option for a particular use case depends on the requirements of the project.
For data storage in the cloud, it is often recommended to use a columnar data format such as Apache Parquet. Parquet is a highly optimized and efficient data format that is specifically designed for big data and cloud-based storage solutions. It uses a columnar storage layout that enables highly compressed data storage and efficient querying, and is compatible with a wide range of data processing and analysis tools, including Databricks, Apache Spark, and Hive.
One of the main advantages of using Parquet for data storage is that it enables efficient data compression, reducing the amount of storage required for the data and lowering the cost of storing and processing the data in the cloud. Parquet also supports a variety of compression algorithms, including Snappy and Gzip, allowing you to choose the compression method that best fits your data and performance requirements.
In terms of the specific storage solution, Azure Blob Storage is a highly scalable and cost-effective solution for storing large amounts of unstructured data. It is ideal for storing data that is not frequently accessed, such as log files or backups.
Amazon S3 is a highly scalable and secure object storage service that is ideal for storing and retrieving large amounts of data. It is also suitable for storing and processing data in a distributed computing environment, such as Databricks or Apache Spark.
Azure SQL Database is a managed relational database service that provides the ability to store structured data in a highly available and scalable manner. It supports SQL Server as its database engine, and is ideal for applications that require a relational database for data storage and retrieval.
The best data storage solution for a particular use case depends on the specific requirements of the project, including the type and size of the data, the frequency of access to the data, and the required performance and scalability. For data storage in the cloud, it is often recommended to use a columnar data format such as Apache Parquet, and choose a storage solution that fits the specific needs of the project, such as Azure Blob Storage, Amazon S3, or Azure SQL Database.
Process
Process of moving the extracted data from the source system to the target system, where it can be stored and analyzed. In the context of Azure Databricks, data loading can be done using Azure Blob Storage or other Azure data stores.
Azure Data Lake Storage
-
Create a Blob Storage Account: First, create an Azure Blob Storage account where the data will be stored. This can be done through the Azure portal or using the Azure CLI.
-
Upload the data to Blob Storage: Next, upload the extracted data to the Blob Storage account. This can be done using the Azure portal, Azure Storage Explorer, or the Azure CLI.
-
Create a Databricks workspace: Next, create an Azure Databricks workspace, which is the environment where the data will be processed and analyzed. This can be done through the Azure portal or using the Azure CLI.
-
Read the data into Databricks: Once the data has been uploaded to Blob Storage, it can be read into Databricks using Spark APIs. This can be done using Databricks notebooks, which provide an interactive environment for data exploration and analysis.
-
Transform the data: After the data has been read into Databricks, it can be cleaned, transformed, and loaded into a data store for further analysis. Databricks provides a variety of Spark APIs for data processing, making it easy to perform complex transformations on large datasets.
-
Store the data: Finally, the transformed data can be stored in a data store, such as Azure Delta Lake, for further analysis and reporting. Delta Lake provides a transactional storage layer that ensures the data is always in a consistent state, making it an ideal storage layer for big data processing and analytics.
These are the basic steps for loading data into Azure Databricks using Azure Blob Storage. Azure Databricks provides a powerful and flexible environment for data processing and analysis, making it an ideal platform for large analytical projects. With Databricks and Blob Storage, you can be confident that your data is stored and processed efficiently, providing valuable insights and driving data-driven decision making.
Data ubiquity
The cloud refers to the widespread availability and accessibility of data across an organization. By breaking down individual data silos and making data available to all stakeholders, data ubiquity enables organizations to share and collaborate on data more effectively and make better informed decisions.
Pros of data ubiquity in the cloud:
-
Improved Collaboration: With data stored in the cloud, it is easier for teams to access and collaborate on data from anywhere, at any time. This helps to improve cross-functional collaboration and enables teams to work together more effectively.
-
Better Data Governance: Data ubiquity makes it easier for organizations to govern their data and manage its quality, consistency, and security. By breaking down silos and making data accessible to everyone, organizations can ensure that everyone is working with the same data and that data is accurate and up-to-date.
-
Increased Efficiency: By having a single source of truth for data, organizations can avoid the inefficiencies and inconsistencies that can arise from having multiple copies of the same data. This helps to improve decision-making and speeds up the decision-making process.
Cons of data ubiquity in the cloud:
-
Security Concerns: Storing data in the cloud raises security concerns, especially for organizations that handle sensitive or confidential information. Organizations need to ensure that their data is protected from unauthorized access and that they have proper security measures in place to prevent data breaches.
-
Cost: Storing data in the cloud can be more expensive than storing it on-premises, especially for organizations that have a large amount of data. Organizations need to weigh the benefits of data ubiquity against the cost of cloud storage to determine whether it makes sense for their organization.
-
Technical Challenges: Implementing data ubiquity in the cloud can be technically challenging, especially for organizations that have complex data structures and workflows. Organizations need to have the technical expertise and resources to implement and manage data ubiquity effectively.
Data ubiquity in the cloud offers several benefits, including improved collaboration, better data governance, and increased efficiency. However, organizations need to be aware of the security, cost, and technical challenges associated with data ubiquity and ensure that they have the resources and expertise to implement and manage it effectively.
Data sovereignty
The laws, regulations, and policies that govern the collection, storage, use, and transfer of personal and confidential data. This is a crucial issue for government agencies and other organizations that handle sensitive information, as they are often required to comply with strict data protection regulations.
In the context of data storage, data sovereignty concerns the physical location of the data and who has control over it. This is particularly relevant in situations where data is stored in the cloud, as cloud providers often store data in multiple data centers located in different countries.
In the case of a government agency that is sensitive to other people being on the same server as their data, and the fall-over being in Australia, data sovereignty is a key concern. The agency would need to ensure that their data is stored in a data center located in Australia and that the data is governed by the laws and regulations of Australia. This would ensure that the agency's data is subject to the privacy and security requirements of the Australian government and that it is protected from unauthorized access, use, and transfer.
To meet these requirements, the agency could choose a cloud provider that has data centers in Australia and that offers robust data protection measures. The agency could also implement additional security measures, such as encryption and multi-factor authentication, to further secure their data.
Control over data
The ability of an organization to manage and govern its data, including who has access to it and how it is used. This is a critical concern for organizations that handle sensitive or confidential information, as they need to ensure that their data is protected from unauthorized access and use.
In regards to data storage, control over data means that the organization hosting the data has the ability to determine who has access to it and what they can do with it. This includes setting permissions and access controls, as well as implementing security measures to prevent unauthorized access and use.
Without the consent of the agency hosting the data, access to it should be limited to only those individuals who have a legitimate need for it. This includes employees, contractors, and third-party service providers who are authorized to access the data for specific purposes.
In addition to managing access, organizations also need to have control over the storage of their data, including where it is stored and how it is backed up and replicated. This helps to ensure that the data is protected from data loss, corruption, and unauthorized access, even in the event of a disaster or security breach.
Control over data is a critical concern for organizations that handle sensitive information. By implementing robust security measures and managing access to their data, organizations can help protect their data from unauthorized access and ensure that they maintain control over it at all times.
Data Preparation
The data collected from various sources may be in different formats and structures, and may need to be transformed to make it usable for analysis. This could involve tasks such as converting data from one format to another, normalizing data structures, or aggregating data to create new variables.
Data preparation for data analytics
OLTP (Online Transaction Processing) and OLAP (Online Analytical Processing) are two different processes, as the requirements for the data are different for each scenario.
-
Data Preparation for Data Analytics: Data preparation for data analytics involves transforming raw data into a format that is suitable for analysis and modeling. This often involves cleaning and transforming the data, such as handling missing values, outliers, and duplicates, and converting categorical variables into numerical values using one-hot encoding. The goal is to create a dataset that can be easily used for predictive modeling, machine learning, and other data analytics tasks.
-
Data Preparation for OLTP and OLAP: Data preparation for OLTP and OLAP is focused on optimizing the data for transactional processing and analytical reporting. This often involves normalizing the data and creating a star or snowflake schema, which separates the data into fact tables and dimension tables. The goal is to ensure that the data is organized in a way that enables fast and efficient query performance, while also reducing data redundancy.
Data preparation for data analytics is focused on transforming data into a format that is suitable for analysis and modeling, while data preparation for OLTP and OLAP is focused on optimizing the data for transactional processing and analytical reporting. Both processes play a crucial role in ensuring that data is usable, accurate, and accessible for the intended purpose.
Data loading into a data warehouse
It involves moving data from various sources into a centralized repository for analysis and reporting. This process is a critical step in the data warehousing process and requires careful planning and execution to ensure that the data is accurate and usable.
One of the key steps in data loading is data normalization. Data normalization is the process of organizing the data in a way that reduces redundancy and ensures that each data item is stored in only one place. This helps to eliminate data duplication and ensures that the data is consistent and accurate.
There are several normalization techniques, including first normal form (1NF), second normal form (2NF), and third normal form (3NF). Each normalization technique builds upon the previous one and adds additional constraints to ensure that the data is organized in the most efficient way possible.
Type 2 dimensioning is another important concept in data warehousing. In a data warehouse, data is often organized into dimensions and facts. Dimensions are used to categorize and describe the data, while facts are used to measure the data. Type 2 dimensions are used to track changes to the dimensions over time. For example, if a customer changes their address, a type 2 dimension would be used to track the change and ensure that the correct address is associated with the customer's data.
Data loading into a data warehouse requires careful planning and execution to ensure that the data is accurate and usable. Normalization and type 2 dimensioning are two important concepts in data warehousing that help to ensure that the data is organized in a way that reduces redundancy and provides a consistent and accurate view of the data. By using these techniques, you can ensure that your data warehouse is a valuable resource for data analysis and reporting.
Building data dimensions and facts
Using a control table is a common approach to data warehousing and analytics. A control table is used to define the mapping between the source tables and the target dimensions and facts.
Here are the steps to build data dimensions and facts out of tables using a control table in Databricks:
-
Define the Control Table: The first step is to define the control table, which lists the mapping between the source tables and the target dimensions and facts. The control table should include columns for the source table name, target dimension or fact name, and any mapping rules or transformations that need to be applied.
-
Load the Source Tables: Load the source tables into Databricks using Spark APIs. This can be done by reading the source data into a Spark DataFrame and storing it in a Delta Lake table for future use.
-
Join the Source Tables: Join the source tables into a single DataFrame using Spark APIs. This can be done by using the join method in Spark and specifying the join conditions based on the columns in the control table.
-
Transform the Data: Apply any necessary transformations to the data based on the mapping rules defined in the control table. This can be done by using Spark APIs, such as the withColumn method, to add new columns or modify existing columns.
-
Load the Dimensions and Facts: Load the dimensions and facts into separate Delta Lake tables using Spark APIs. This can be done by using the write method in Spark and specifying the target table name.
-
Update the Control Table: Finally, update the control table to reflect that the dimensions and facts have been loaded. This can be done by using Spark APIs, such as the insertInto method, to add new rows to the control table.
By using a control table in Databricks, you can automate the process of building data dimensions and facts from source tables. The control table provides a centralized place to define the mapping between the source tables and the target dimensions and facts, making it easy to understand and maintain the data pipeline. Additionally, by using Delta Lake, you can ensure that the data is stored in a transactional manner, providing a consistent and accurate view of the data for analysis and reporting.
Maintaining the control table and schema
Keeping the control table up-to-date ensures that the data pipeline remains accurate and that the data dimensions and facts reflect the current state of the source data.
There are three types of scenarios that need to be considered when maintaining the control table and schema:
-
Data that is new and gets added: This scenario occurs when new data is added to the source system that has not been previously loaded into the data warehouse. In this case, a flag in the control table should be set to 1 to indicate that the data should be loaded into the data warehouse. The schema of the data warehouse should also be updated to include the new data fields.
-
Data that is not known and will not get loaded this time: This scenario occurs when the source data contains fields that are not known to the data warehouse and will not be loaded into the data warehouse. In this case, a flag in the control table should be set to 0 to indicate that the data needs investigation. The data should be reviewed to determine if it is relevant to the data warehouse and if it should be loaded.
-
Data that will get deleted: This scenario occurs when data is deleted from the source system and should also be deleted from the data warehouse. In this case, a flag in the control table should be set to -1 to indicate that the data should be deleted from the data warehouse. The schema of the data warehouse should also be updated to remove the deleted data fields.
To ensure that the control table and schema are maintained accurately, it is important to have a process in place for reviewing and updating the control table. This process should be automated as much as possible to ensure that it is efficient and effective. For example, you could use Databricks and Delta Lake to automate the process of updating the control table and schema based on the flags set in the control table. By automating the process, you can ensure that the control table and schema are always up-to-date and that the data pipeline remains accurate.
ACID guarantees
ACID (Atomicity, Consistency, Isolation, Durability) is a set of properties that ensure database transactions are processed reliably. It is a commonly used term in the context of relational databases, and it ensures that a transaction is treated as a single, indivisible unit of work.
In the context of Azure Databricks, ACID transactions provide a way to ensure the consistency and integrity of data, even when multiple users are accessing and modifying the data simultaneously. With ACID transactions, you can be confident that the data will be updated correctly and that the changes will persist, even if the transaction fails for some reason.
Databricks implements ACID transactions by leveraging Delta Lake, which is an open-source storage layer built on top of Apache Spark. Delta Lake provides a transaction log that records all changes to the data, ensuring that the data is always in a consistent state. It also provides optimizations for efficient batch processing and real-time streaming, making it an ideal storage layer for big data processing and analytics.
ACID transactions provide a way to ensure that database transactions are processed reliably and that the data is always in a consistent state. Azure Databricks provides this functionality through Delta Lake, which is an open-source storage layer built on top of Apache Spark. With ACID transactions in Azure Databricks, you can be confident that your data is always accurate, even when multiple users are accessing and modifying it simultaneously.
Data Validation
After the data has been transformed, it is important to validate it to ensure that it is accurate and complete. This could involve checking for missing values, incorrect data types, or other data quality issues.
Data Loading into Target System
Once the data has been validated, it is loaded into the target system for analysis. This could involve loading the data into a data lake, a data warehouse, or a database for further processing.
Data Analytics
Data Analysis: After the data has been cleaned, it is ready for analysis. The analysis will involve descriptive, exploratory, and inferential analysis using R and SQL. Descriptive analysis will summarise the data's characteristics, such as the mean and standard deviation. Exploratory analysis will involve generating visualizations and conducting hypothesis testing to identify patterns and relationships in the data. The inferential analysis will be used to make predictions and generalize findings to a larger population.
-
Descriptive Analytics: Descriptive analytics is the process of summarizing and describing the characteristics of a dataset. This type of analysis is used to describe the key features of the data, such as the mean, median, and mode, and to produce visualizations, such as histograms and scatter plots, to help understand the distribution of the data.
-
Diagnostic Analytics: Diagnostic analytics explores the data to understand the causes of specific outcomes or patterns. This type of analysis involves drilling into the data to uncover the root causes of particular events or trends.
-
Predictive Analytics: Predictive analytics uses historical data and statistical models to make predictions about future events or outcomes. This analysis involves building models that use variables to predict future results, such as sales or customer behaviour.
-
Prescriptive Analytics: Prescriptive analytics uses optimization algorithms and simulation models to determine the best course of action. This analysis involves finding the optimal solution to a specific problem, such as scheduling resources or optimizing a supply chain.
Setting alarms and key performance indicators (KPIs)
An essential data analysis component are alarms that trigger alerts when specific conditions are met, such as when a data point exceeds a threshold value. KPIs are used to measure the performance of particular aspects of a business, such as sales or customer satisfaction, and to track progress over time.
Data analysis is an integral part of the project, as it allows for extracting valuable insights and discovering trends and patterns in the data. The specific type of data analysis performed will depend on the project's particular requirements and the analysis's business goals.
Machine learning and data analysis
There are two main types of data preparation for these purposes:
-
Data prepared for machines: This type of data preparation is focused on transforming data into a format that is easily interpreted by algorithms. This often involves one-hot encoding, where categorical variables are transformed into binary columns, and numerical data is normalized.
-
Data prepared for humans: This type of data preparation is focused on transforming data into a format that is easily understandable by humans. This often involves encoding categorical variables as nominal or ordinal variables, and transforming written words into numerical values through the use of natural language processing techniques.
It's important to understand the differences between these two types of data preparation, as they can have a significant impact on the results of any data analysis or machine learning project. By carefully selecting the right type of data preparation for the task at hand, it's possible to ensure that the data is in a format that is easily interpreted and acted upon, providing valuable insights and predictions.
Automation
Automated Ingestion
Automated Ingestion: The final step is to automate the ingestion of newly acquired data into the cloud database. A script automatically extracts and loads the new data, eliminating the need for manual intervention.
Automated ingestion automatically imports and transforms data into a desired format for analysis.
Overnight chron jobs are automated tasks that run during off-hours, typically overnight. These jobs can be used to automate the ingestion process so that the data is ready for analysis when the workday begins. This allows for the efficient use of resources and ensures that the data is up-to-date and accurate.
Automated ingestion is an essential step in any data analytics project. Automating the process allows data to be quickly and efficiently transformed into the desired format, ready for analysis. The final product is a project directory containing all the necessary information, making it easy for data analysts to access and use for their analysis.
Visualization
Visualization: To communicate insights and results effectively, interactive and meaningful visualizations will be generated using R packages such as ggplot2 and plotly. These visualizations will clearly and concisely represent the findings and help convey the results to stakeholders.
- Visualization: In the fifth step of the project, the data analysis results will be presented clearly and intuitively. Visualization helps to communicate the insights derived from the data and makes it easier for stakeholders to understand and act on the results.
There are several graphical primitives used in data visualization, including points, lines, bars, and shapes. These primitives are combined to create a wide range of charts, including univariate and multivariate charts.
Univariate charts are used to represent data with a single variable, such as a histogram or a bar chart. Multivariate charts are used to describe data with two or more variables, such as a scatter plot or a heat map.
Documentation
Documentation: The project must be easily replicable and understandable, all R scripts and analysis steps will be documented using RMarkdown. This will include code snippets, visualizations, and a narrative explanation of the analysis process.
Documentation is an essential part of any data analytics project. It records the steps taken to collect, clean, transform, and analyze data. In addition, it helps others understand the analysis and makes it easier to replicate the work in the future.
RMarkdown or Quatro documents are a great way to document a data analytics project. They allow you to combine text, code, and data in the same document, making it easier to understand the analysis and follow the steps.
Bookdown is a tool that can be used to bundle RMarkdown or Quatro documents into a single, organized document. This document, called a "book", can include a table of contents, sections for each step in the analysis, and figures and tables to illustrate the results.
By using RMarkdown, Quatro documents, and bookdown to document the data analytics project, you can ensure that the steps and results are well-documented and easily accessible to others. This makes it easier for others to understand the analysis and replicates the work in the future.
In conclusion, documentation is an integral part of any data analytics project. By using RMarkdown, Quatro documents, and bookdown, you can ensure that the steps and results are well-documented and easily accessible to others. This makes the analysis more transparent and reproducible.
Timeliness
Timeliness: The project timeline is one month, with the option to extend it if necessary. The project should be completed within this timeframe to ensure it is delivered within budget and meets the stakeholders' requirements.
Timeliness is essential to any data analytics project, as it often needs to meet specific deadlines or time frames. Two main project management approaches can be used for data analytics projects: Agile sprints and the Waterfall approach.
Agile sprints are a popular approach for data analytics projects. They are usually two-week sprints where a team works together to complete specific tasks. This approach is ideal for rapidly changing projects or needs to be flexible in response to new information. The Agile sprint approach allows the team to work quickly and iteratively and adjust the project as required.
The Waterfall approach, on the other hand, is a linear, sequential approach to project management. This approach is more suitable for projects with a well-defined scope, timeline, and budget. This approach completes each project phase before moving on to the next stage. This approach is ideal for projects with a clear end goal and must follow a specific set of steps to reach it.
In addition to choosing the right project management approach, it is vital to use a project schedule and catalogue. The project schedule should include the following:
-
A timeline of the tasks to be completed.
-
The start and end dates for each job.
-
The dependencies between tasks.
The project catalogue should include detailed information, including its goals, objectives, and expected outcomes.
Finally, it is crucial to estimate the total cost of the project. This includes the cost of resources, such as software and hardware, and the cost of human resources, such as salaries and benefits. The total cost estimate should be based on the project's scope, the resources required, and the timeline for completion.
In conclusion, timeliness is a crucial aspect of any data analytics project. Choosing the right project management approach, using a project schedule and catalogue, and estimating the project's total cost can help ensure that the project is completed on time and within budget.
Ready to take your data analysis to the next level? Book your time with us today and let our team of experts help you unlock the full potential of your data. With our step-by-step process, we'll work with you to ensure your project is completed on time, within budget, and with maximum impact. Don't wait, book your time now and get started on your data journey!